Data Visualization Deck
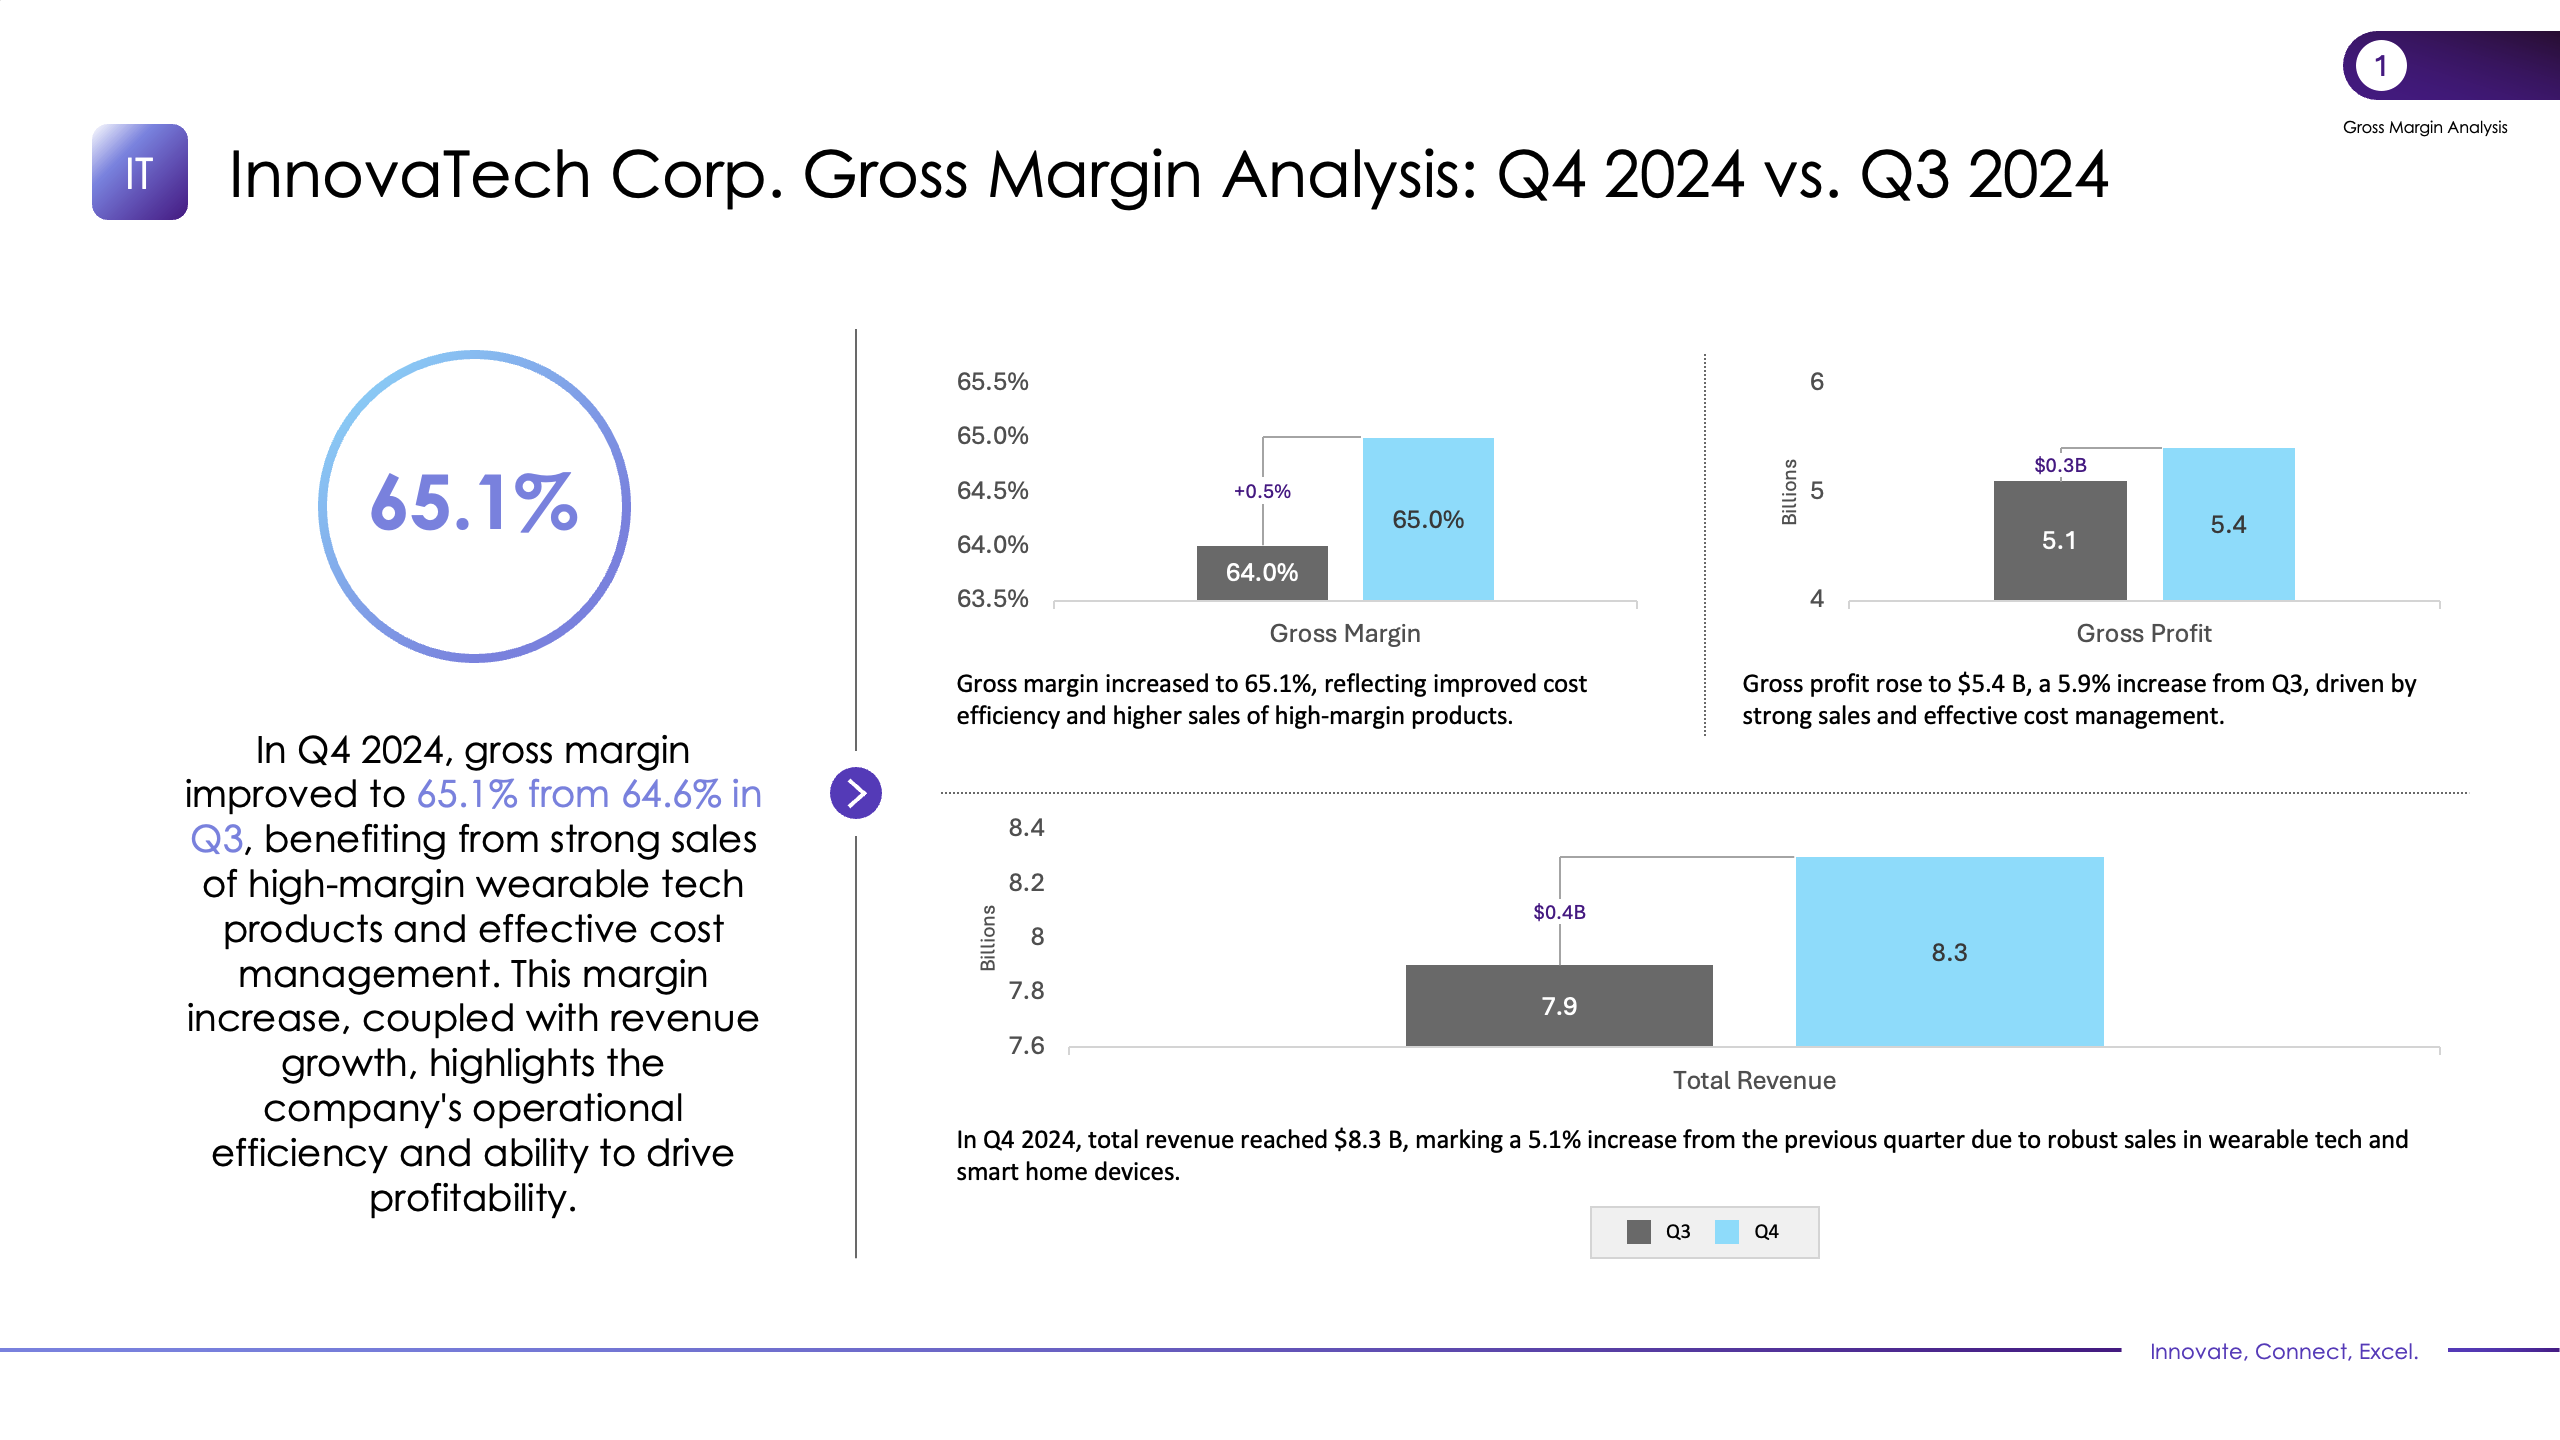
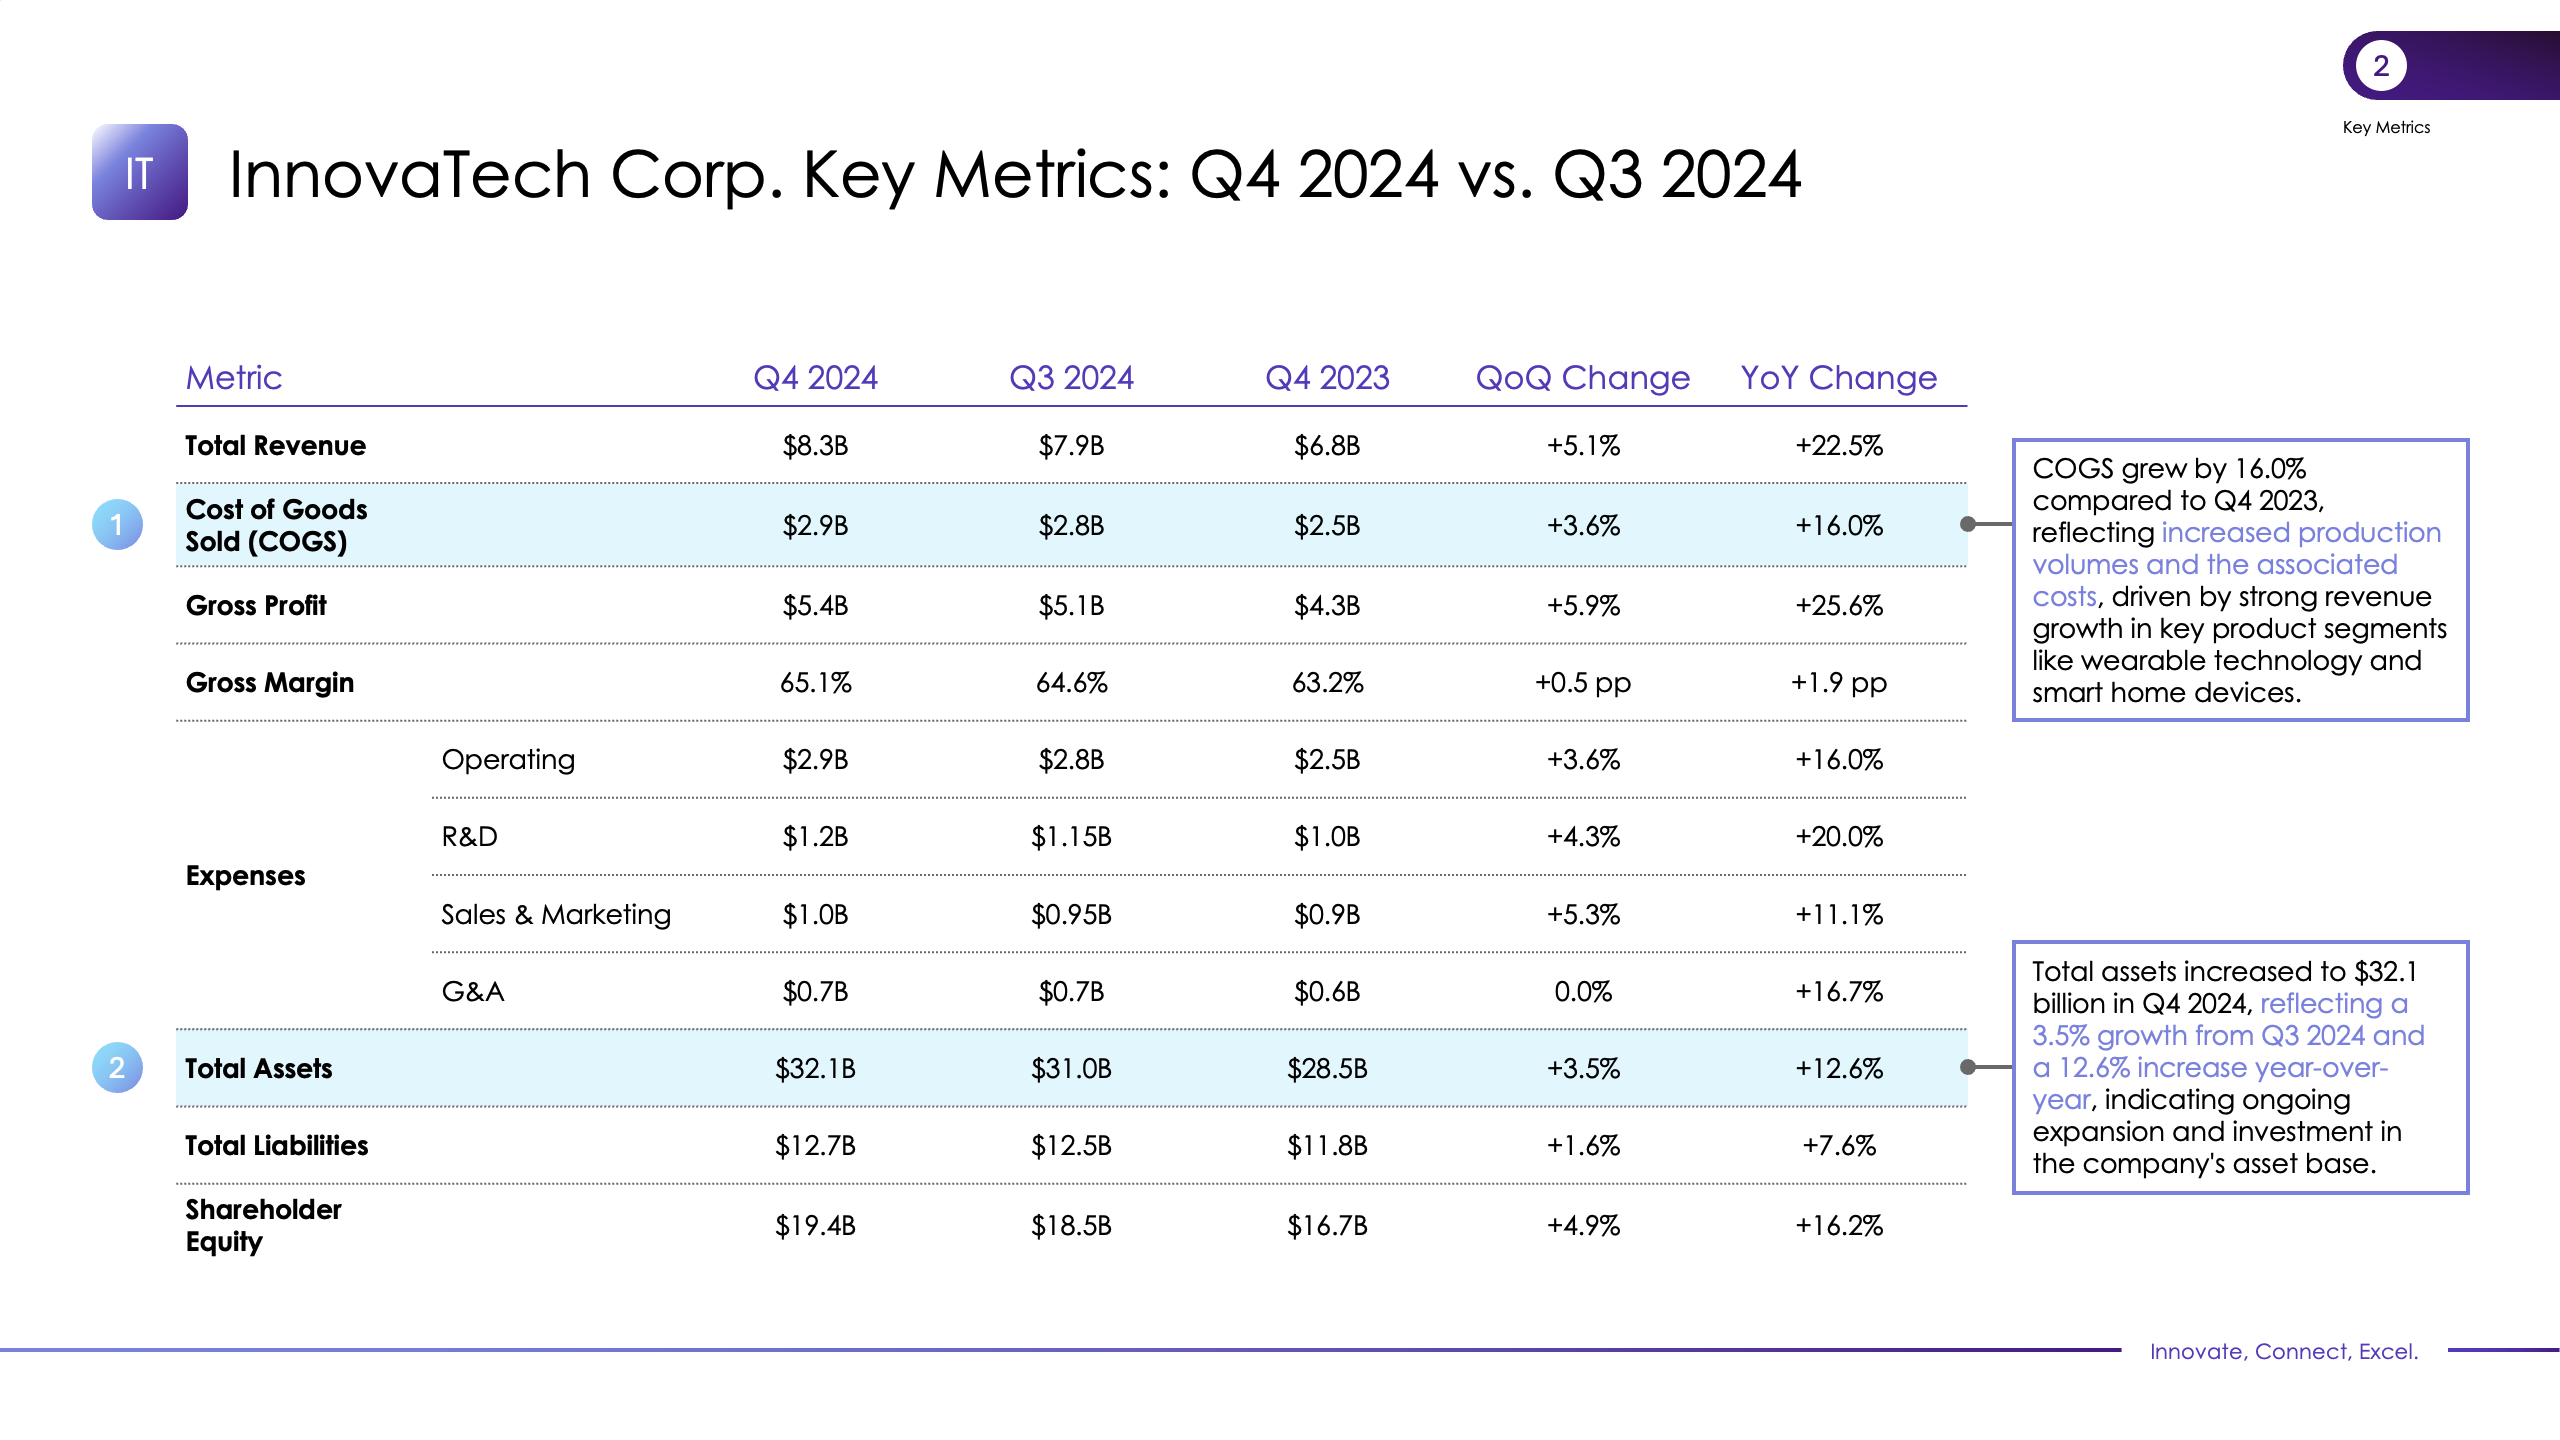
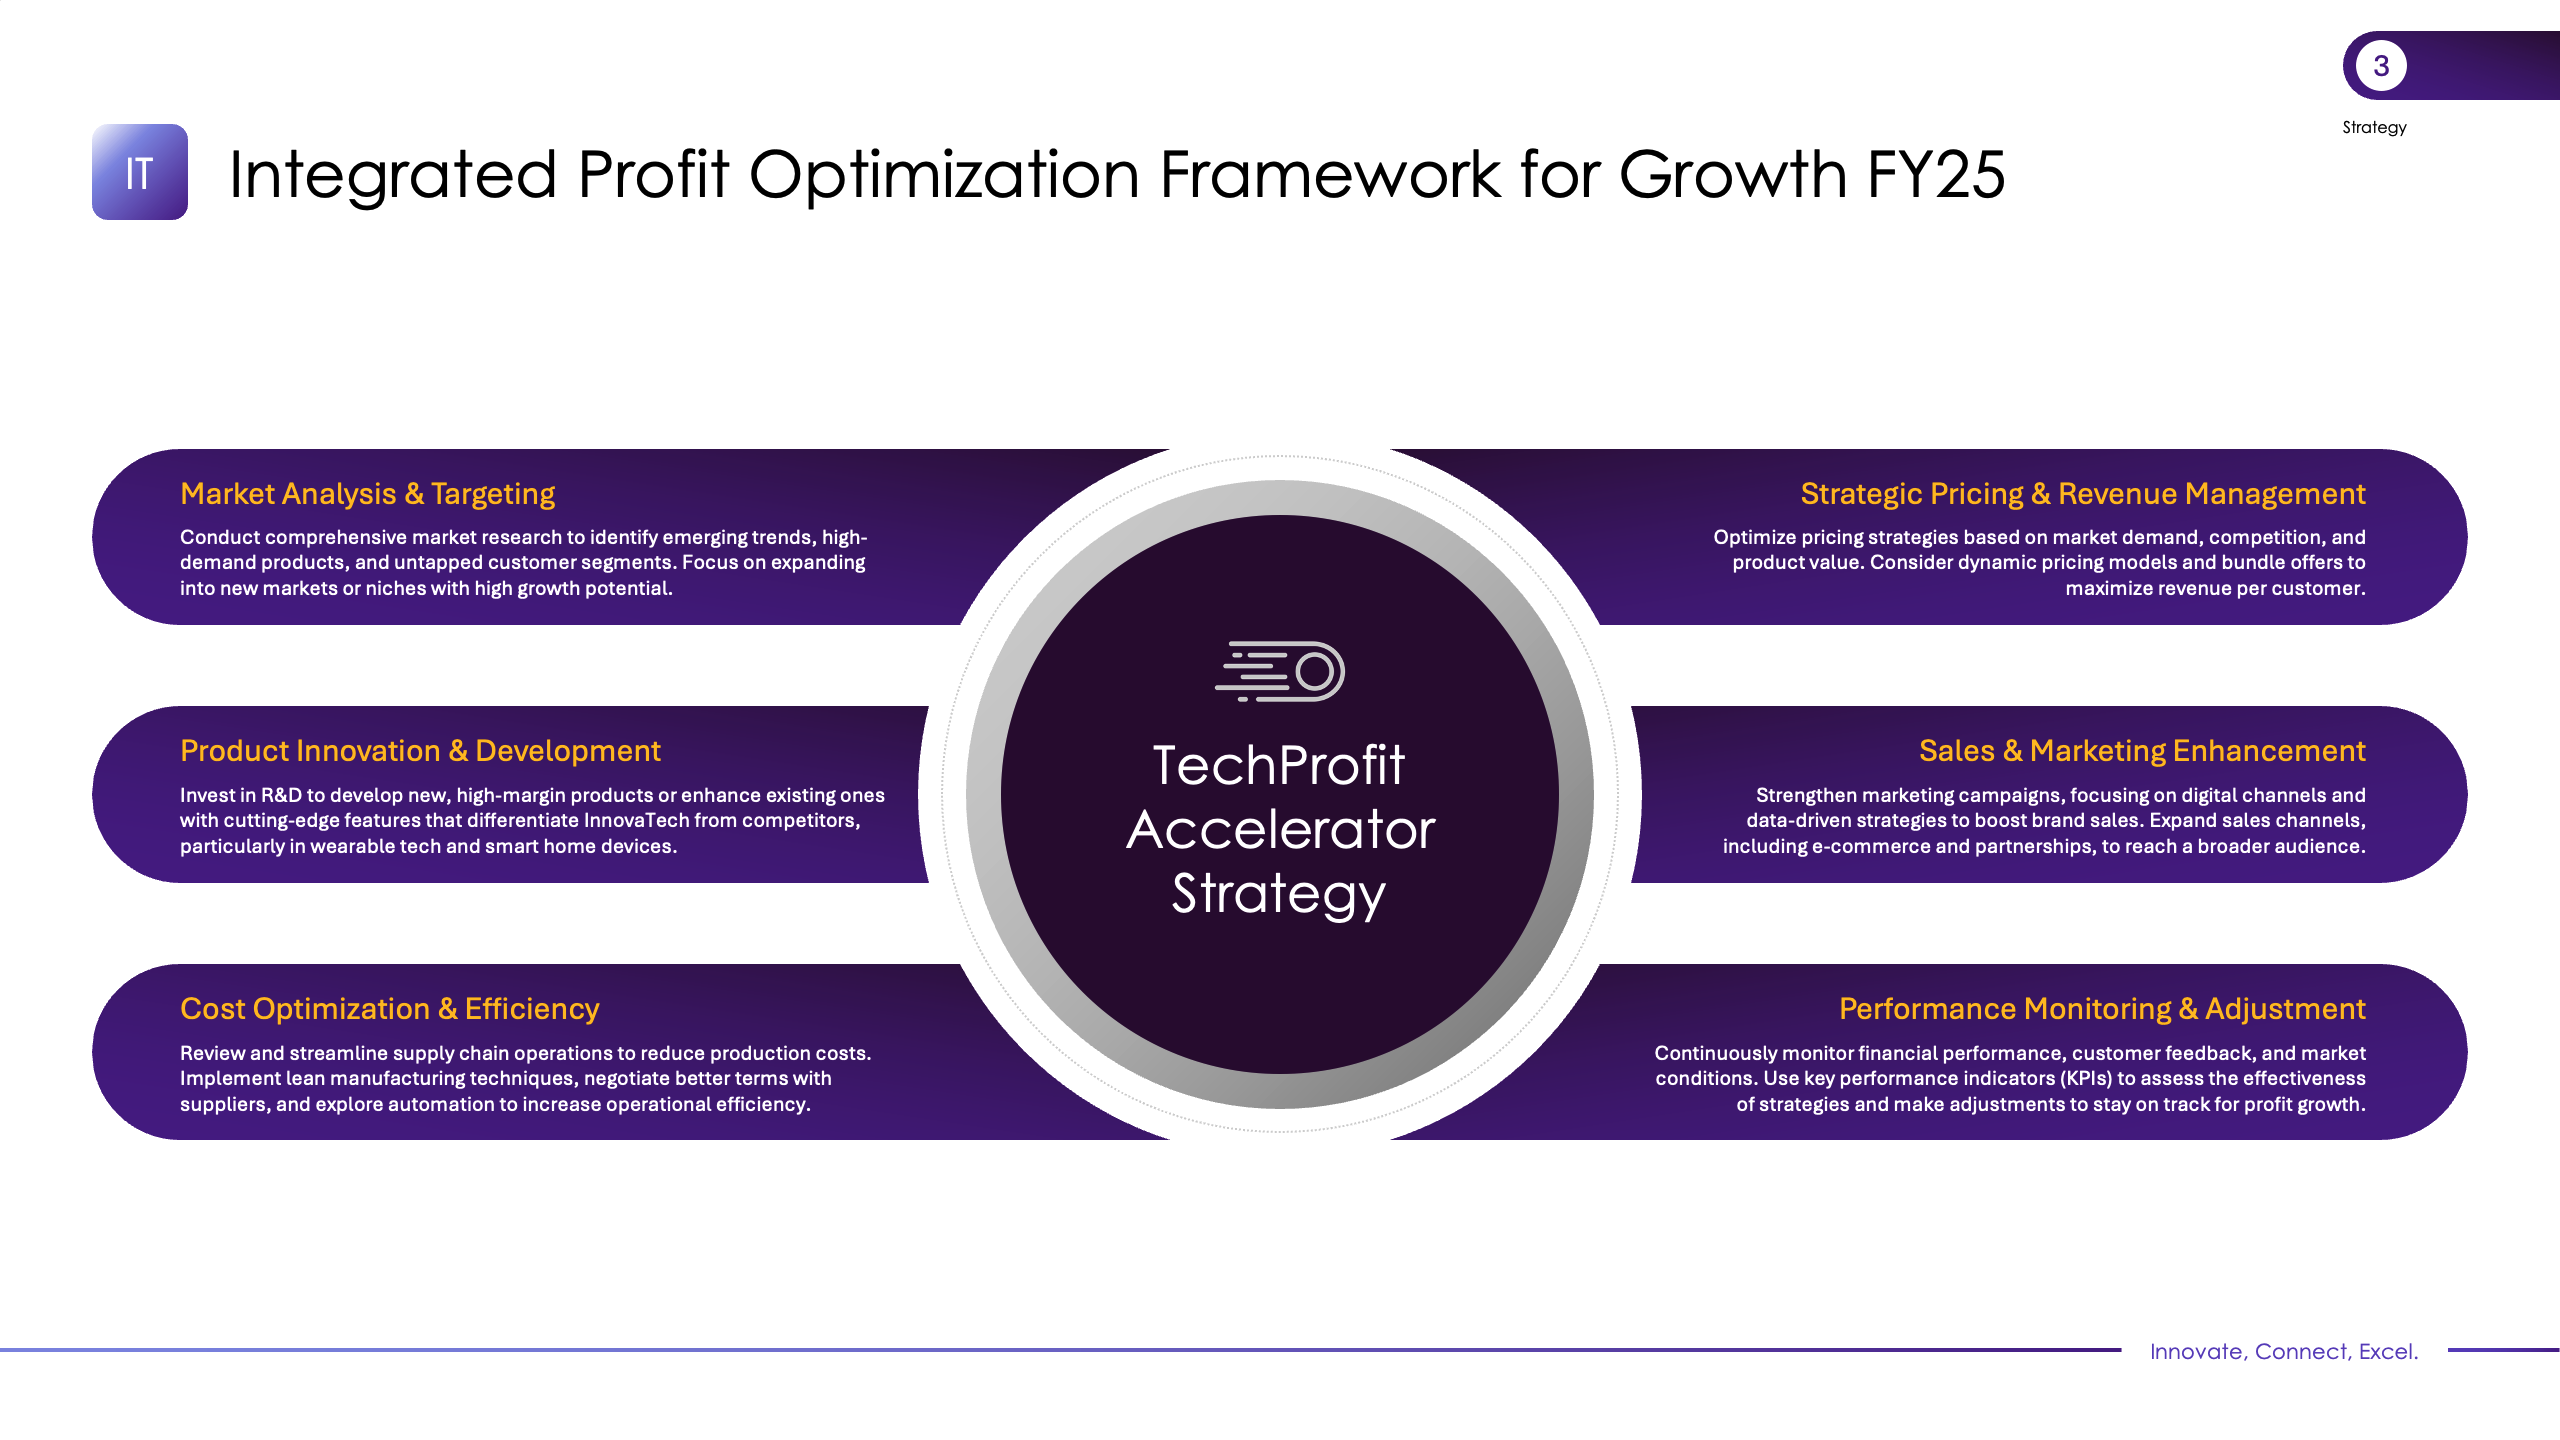
Designed with a focus on clear data visualization and corporate branding, the breakdown provides an in-depth analysis of InnovaTech Corp's financial performance. The layout is structured to effectively communicate key fiscal metrics, including gross margin, total revenue, and cost of goods sold, using easy-to-read tables and charts. The use of consistent fonts, a professional color scheme, and clean lines enhances the clarity and professionalism of the report. The slides are well-organized to allow viewers to follow the progression of financial data, with each section offering insights into quarterly performance, year-over-year changes, and strategic initiatives for future growth. The integration of graphs, financial summaries, and strategy outlines make complex information more accessible and visually engaging. This presentation’s design strikes a balance between data-heavy content and visually appealing graphics, making it an effective tool for internal corporate reviews and shareholder updates. It also highlights strategic goals, such as cost optimization and market expansion, through a clear and structured approach.


